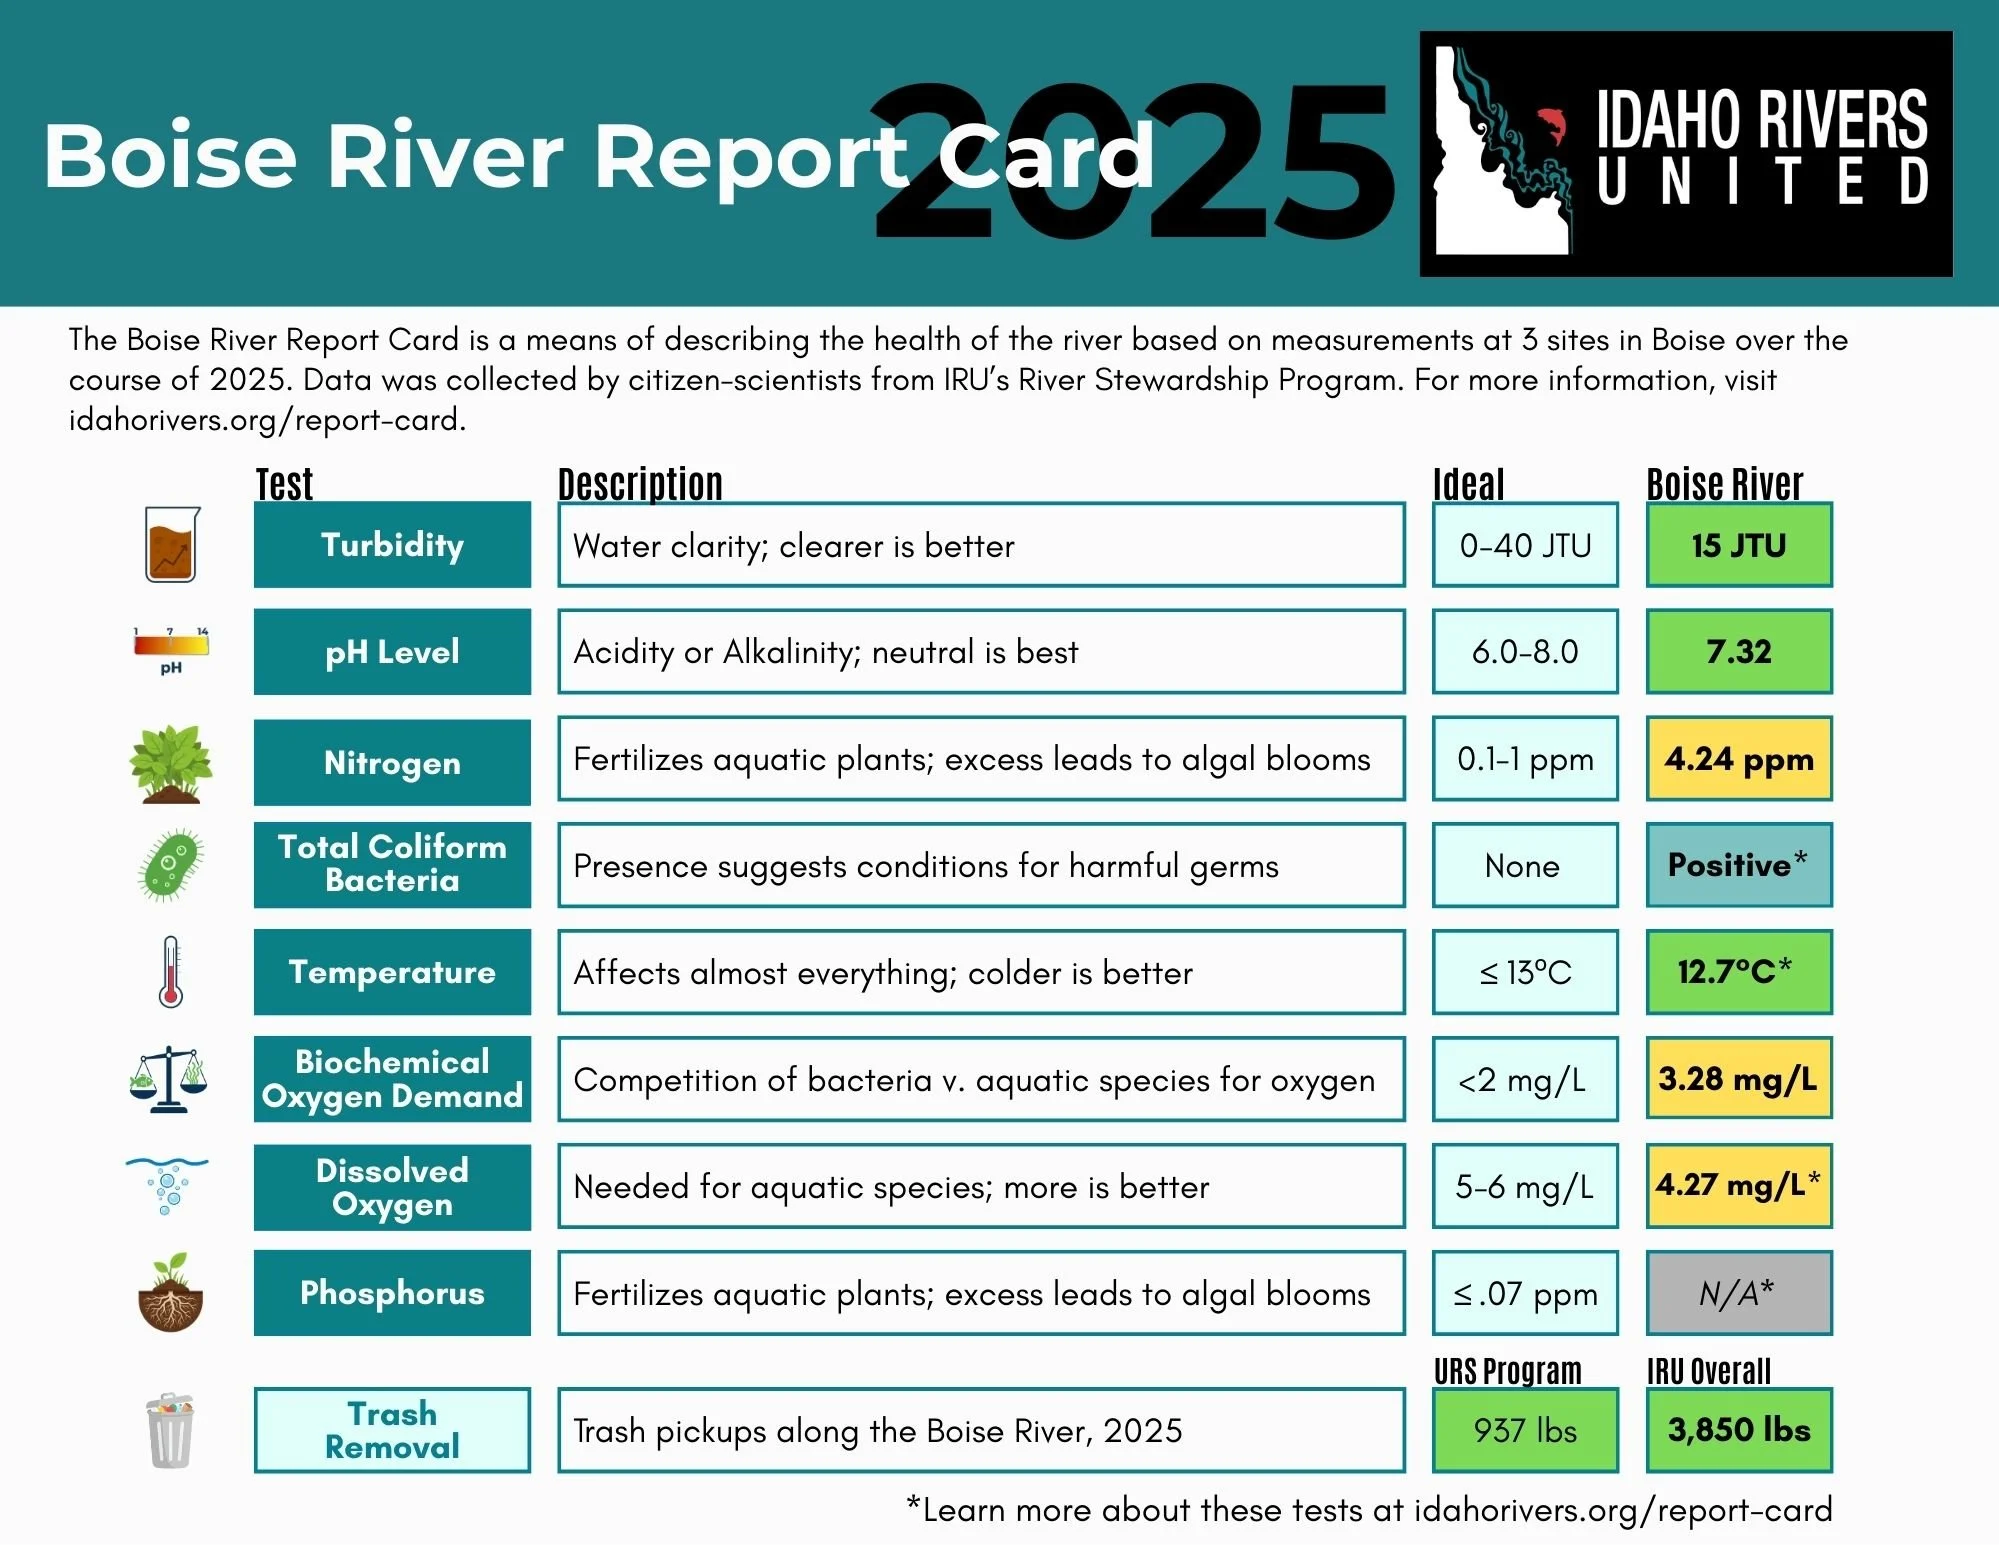
Boise River Report Card
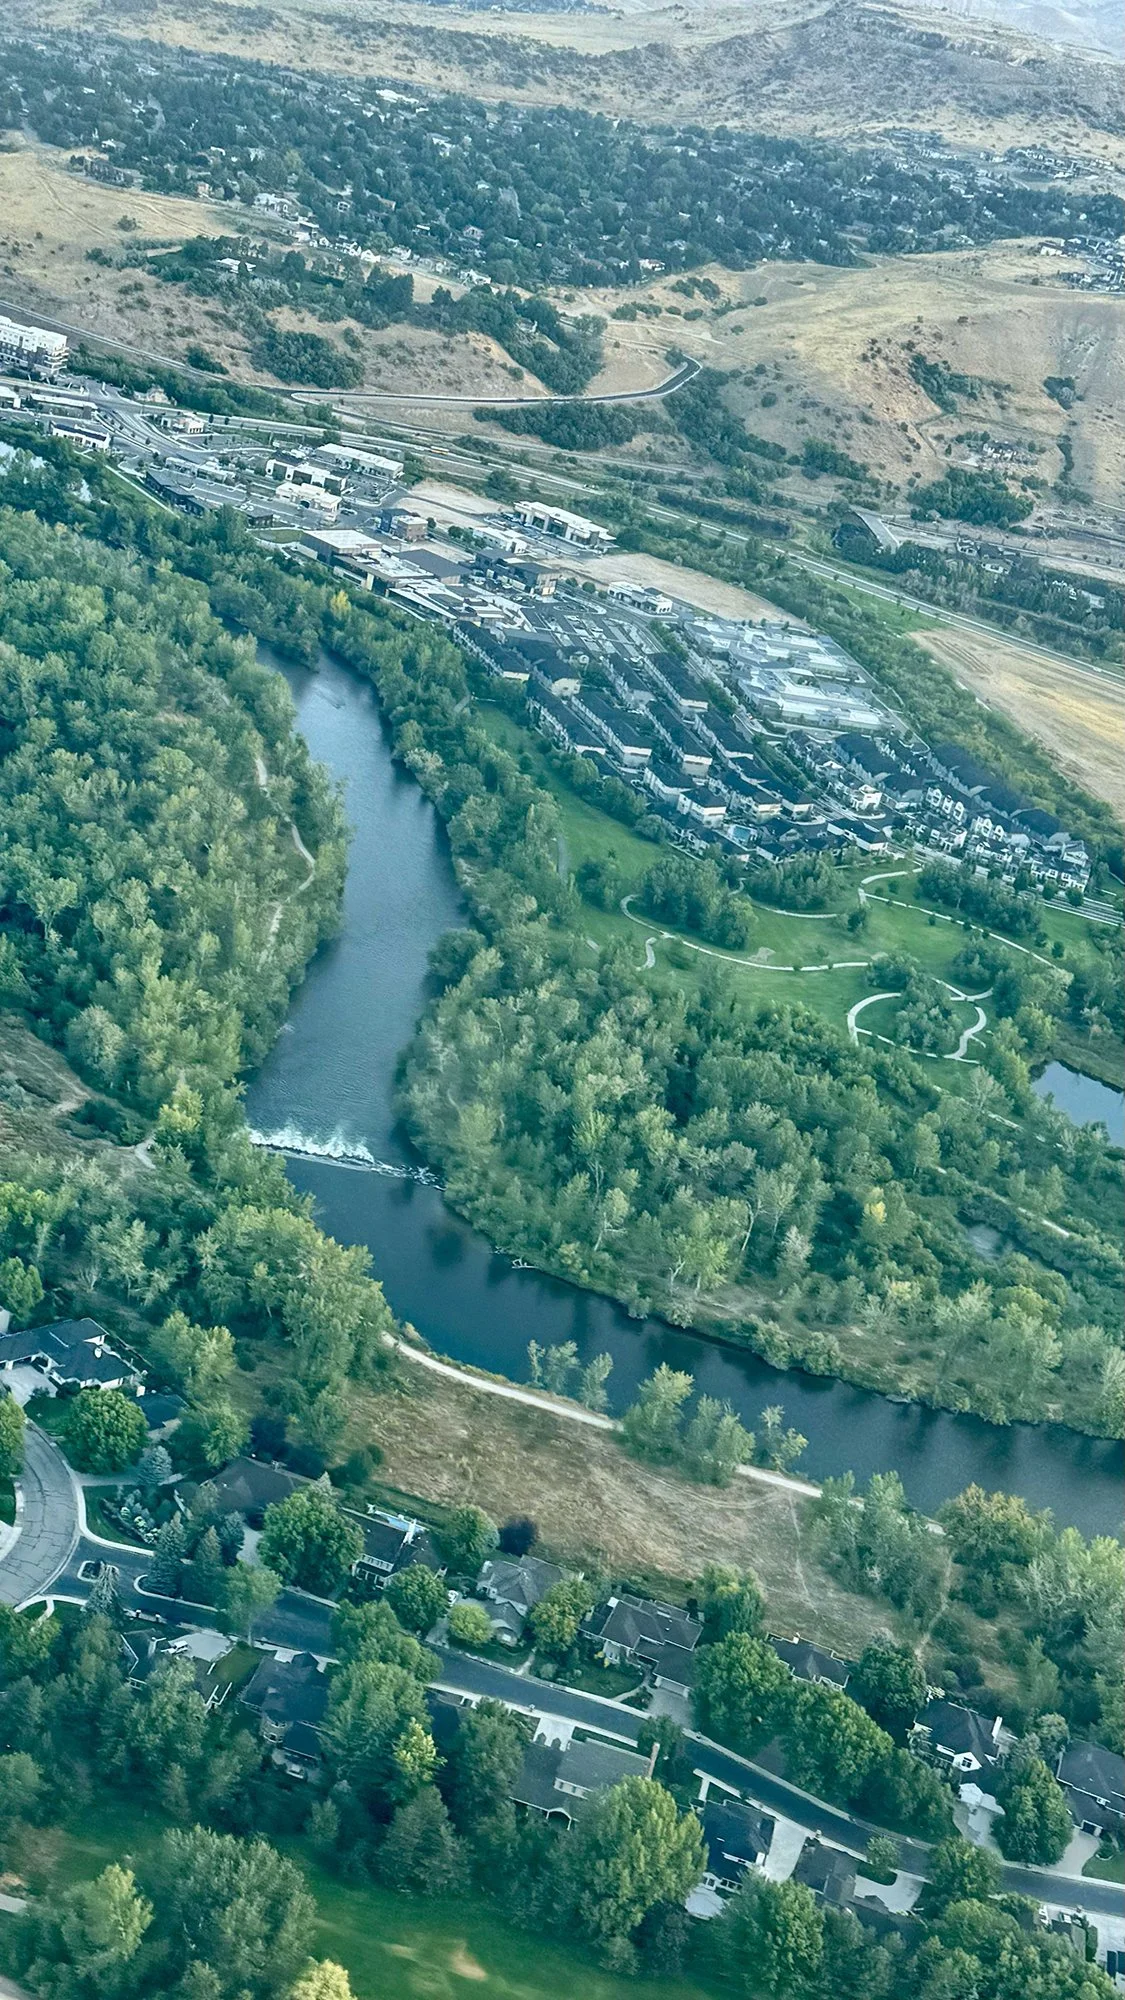
The Boise River is one of the Treasure Valley’s most critical natural resources. What was once used as a dump site for industries, now is the lifeblood for recreation, wildlife, agriculture, and local communities. The Idaho Department of Environmental Quality has designated several beneficial uses for the river section that runs through the heart of Boise. These include our drinking water supply, recreation, habitat for cold water aquatic organisms, and the potential to support salmonid spawning. Unfortunately, impacts on the river’s water quality prevent some of these uses from being fully supported. Over the past decades, thankfully, water quality in the Boise River has drastically improved. However, the increase in population growth and development along the river will continue to bring challenges in protecting the health of the Boise.
Because many aspects of our lives rely on a healthy Boise River, understanding its condition is vital to preserving the resources, experiences, and history that connect us all. The report card uses water quality data, collected by our Boise River Stewards, to provide a snapshot of the state of the river from this past year and inform how our actions can shape its future.
Navigate the Report
View the Report Card. See below for additional information.
History of the Boise River
The Boise River created a valley that has drawn in humans for thousands of years. Originally, the river was an important area for fishing, hunting, gathering, and harvesting for the indigenous people. Many tribes, including the Shoshone, Bannock, Northern Paiute, and Nez Perce, used the river as a rendezvous spot for trading.
-
When white settlers took over the valley in the mid-19th century, the tribes were forcibly displaced from the area and the landscape started to change. Most early settlements developed on the northern side of the river to avoid flooding. From 1908-1955, Anderson Ranch, Arrowrock, Lucky Peak, and Diversion dams were built for flood control and irrigation. This turned the Boise River from a wild, free-flowing, and flood-prone river into a managed river system. While the dams have enabled urban growth and made it possible to farm in a high-desert climate, they have also simplified the river’s natural flow, draining many wetlands and causing significant habitat loss for native plant and animal species.
Between the 1940s-1960s, the Boise River was not valued like it is today. It was heavily polluted and being used as a disposal site for garbage, sewage, and animal waste. The water quality was so poor that fish were becoming contaminated with toxins and were unsafe to eat.
Things began to improve after the Clean Water Act passed in 1972, which set limits on the pollution allowed to enter the river and required the removal of accumulated debris and toxic sludge. By 1975, the first segment of the Boise River Greenbelt was built, and the river was on its way to becoming one of the most treasured resources in the valley once again.
Today we see a much healthier river corridor through the Treasure Valley. Recreation and wildlife are hallmarks of today’s Boise River. But we must be vigilant in the face of development and a booming population if we are to preserve the health of our river.
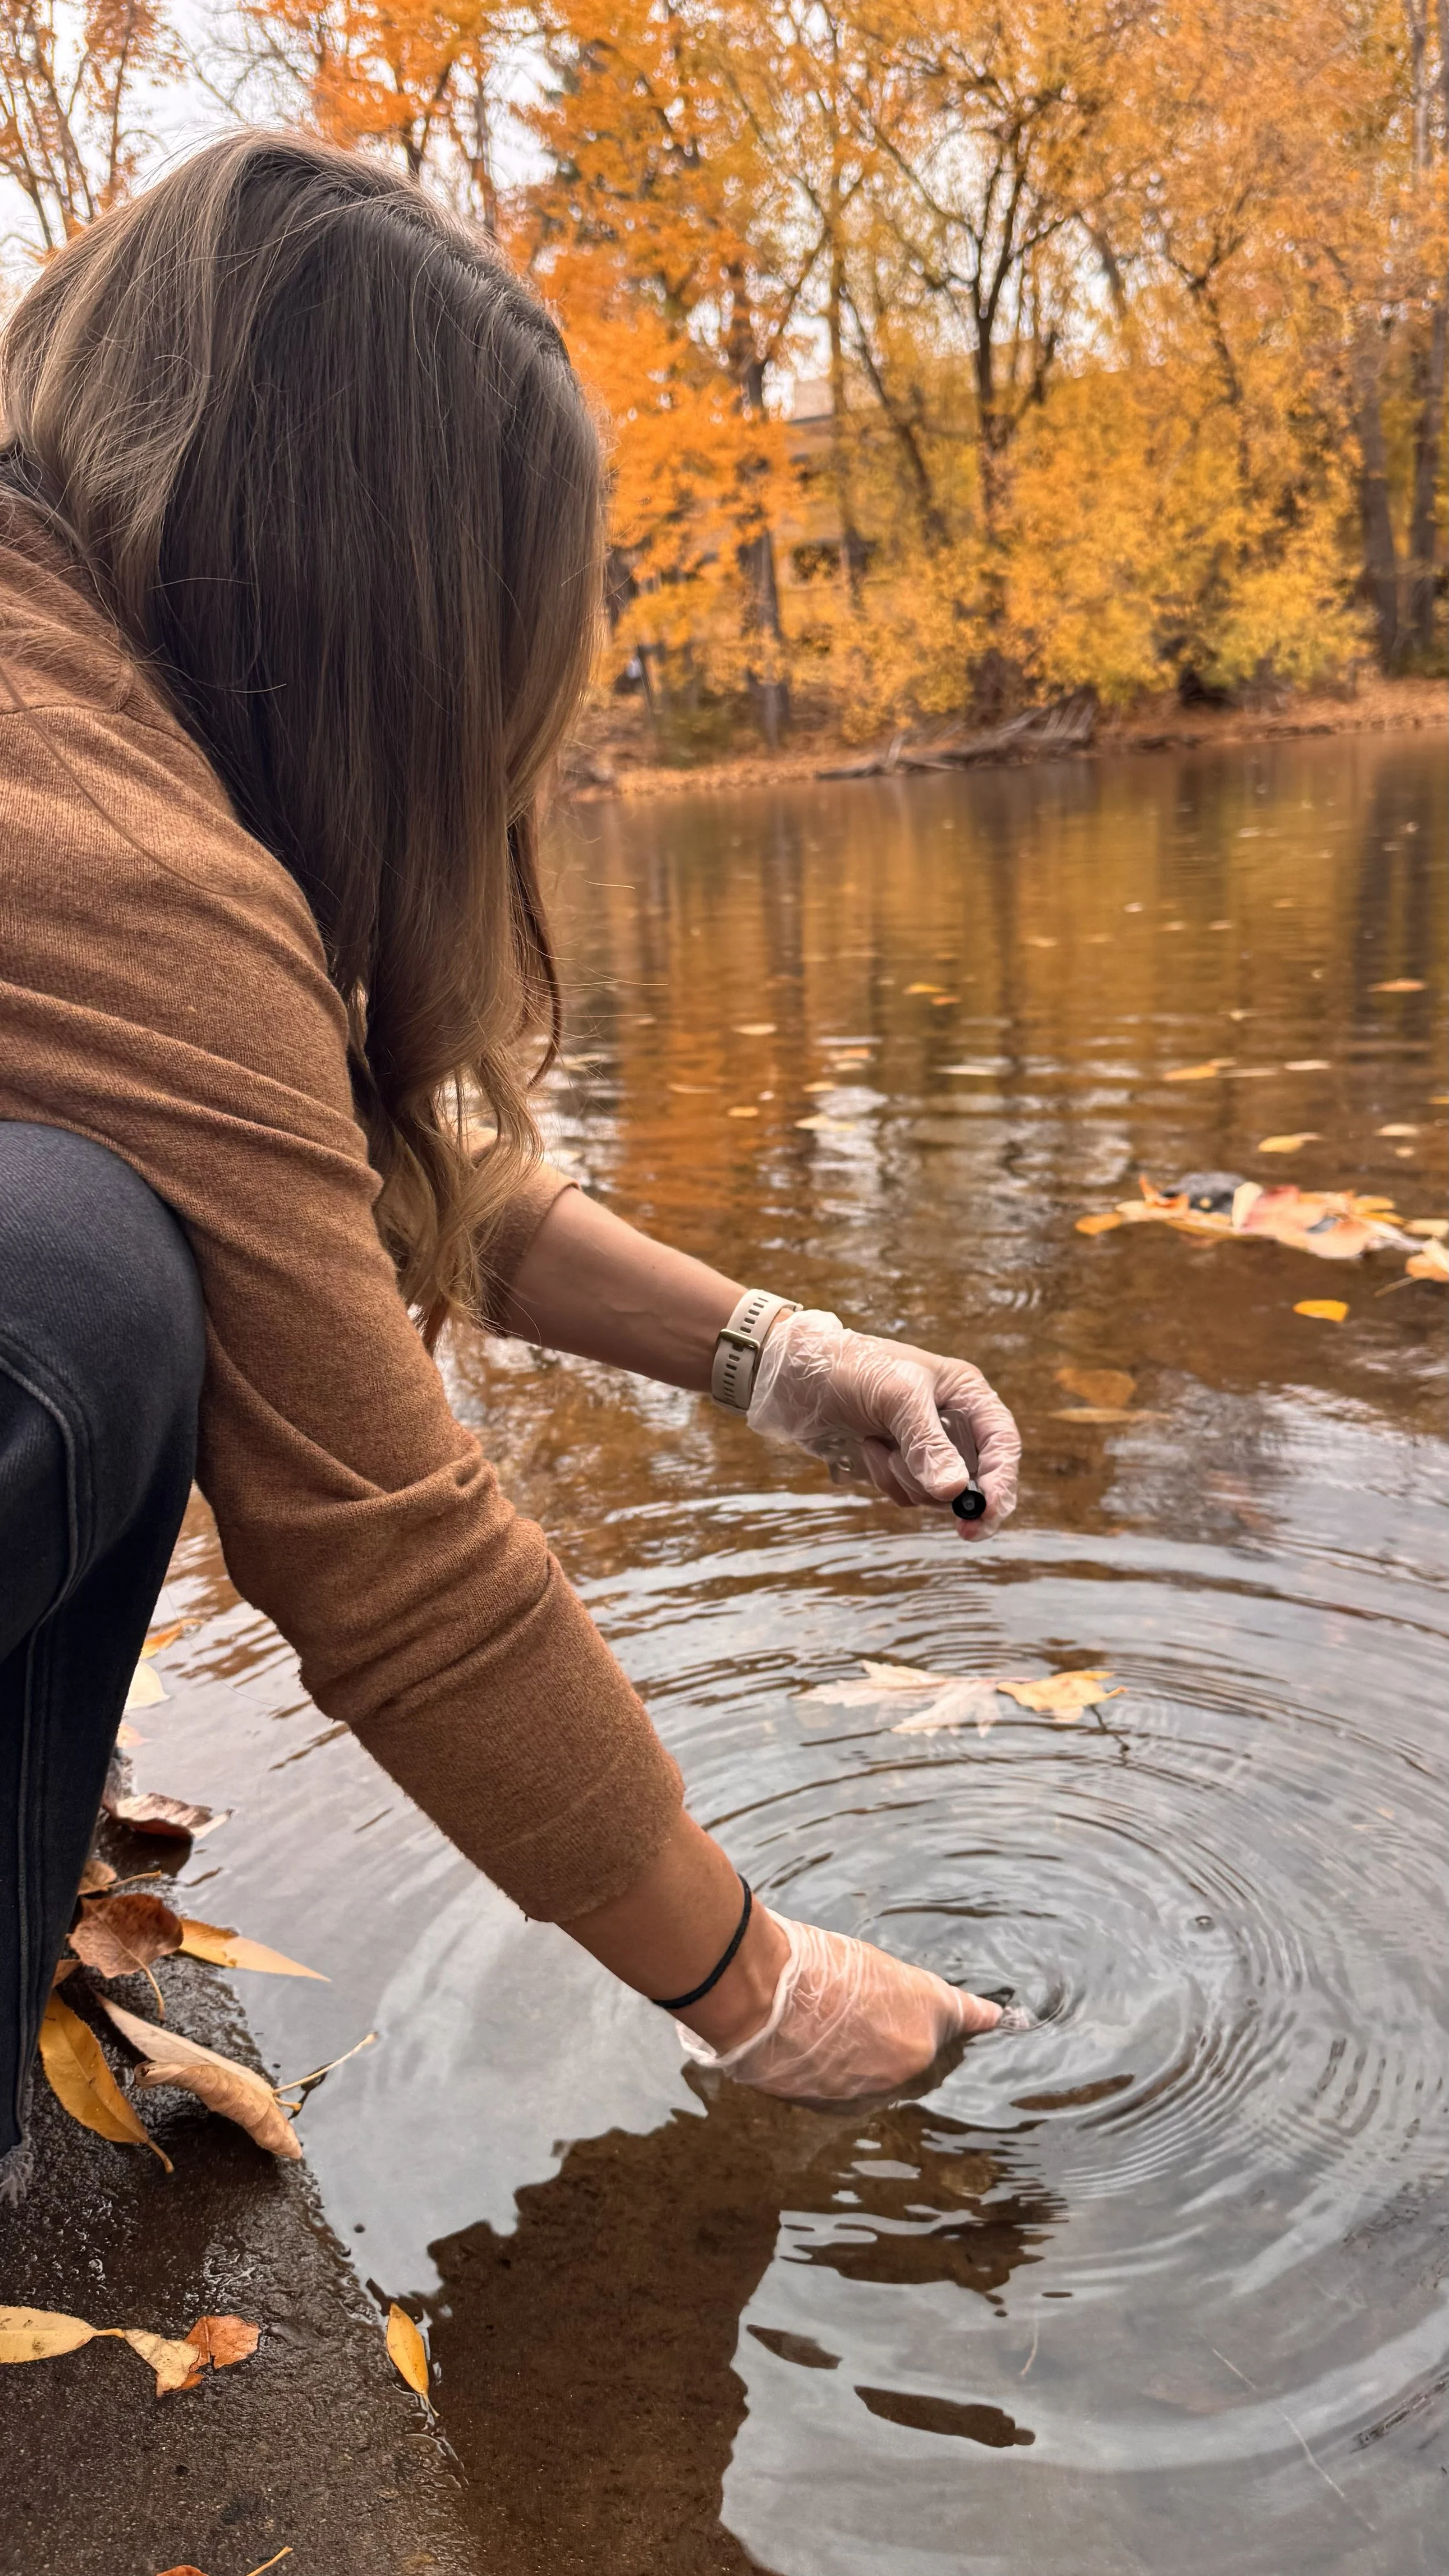
Boise River Stewards
This report is only possible because of the volunteer efforts of our Boise River Stewardship (BRS) Program, and we want to ensure they receive the well-deserved credit for their hard work and dedication.
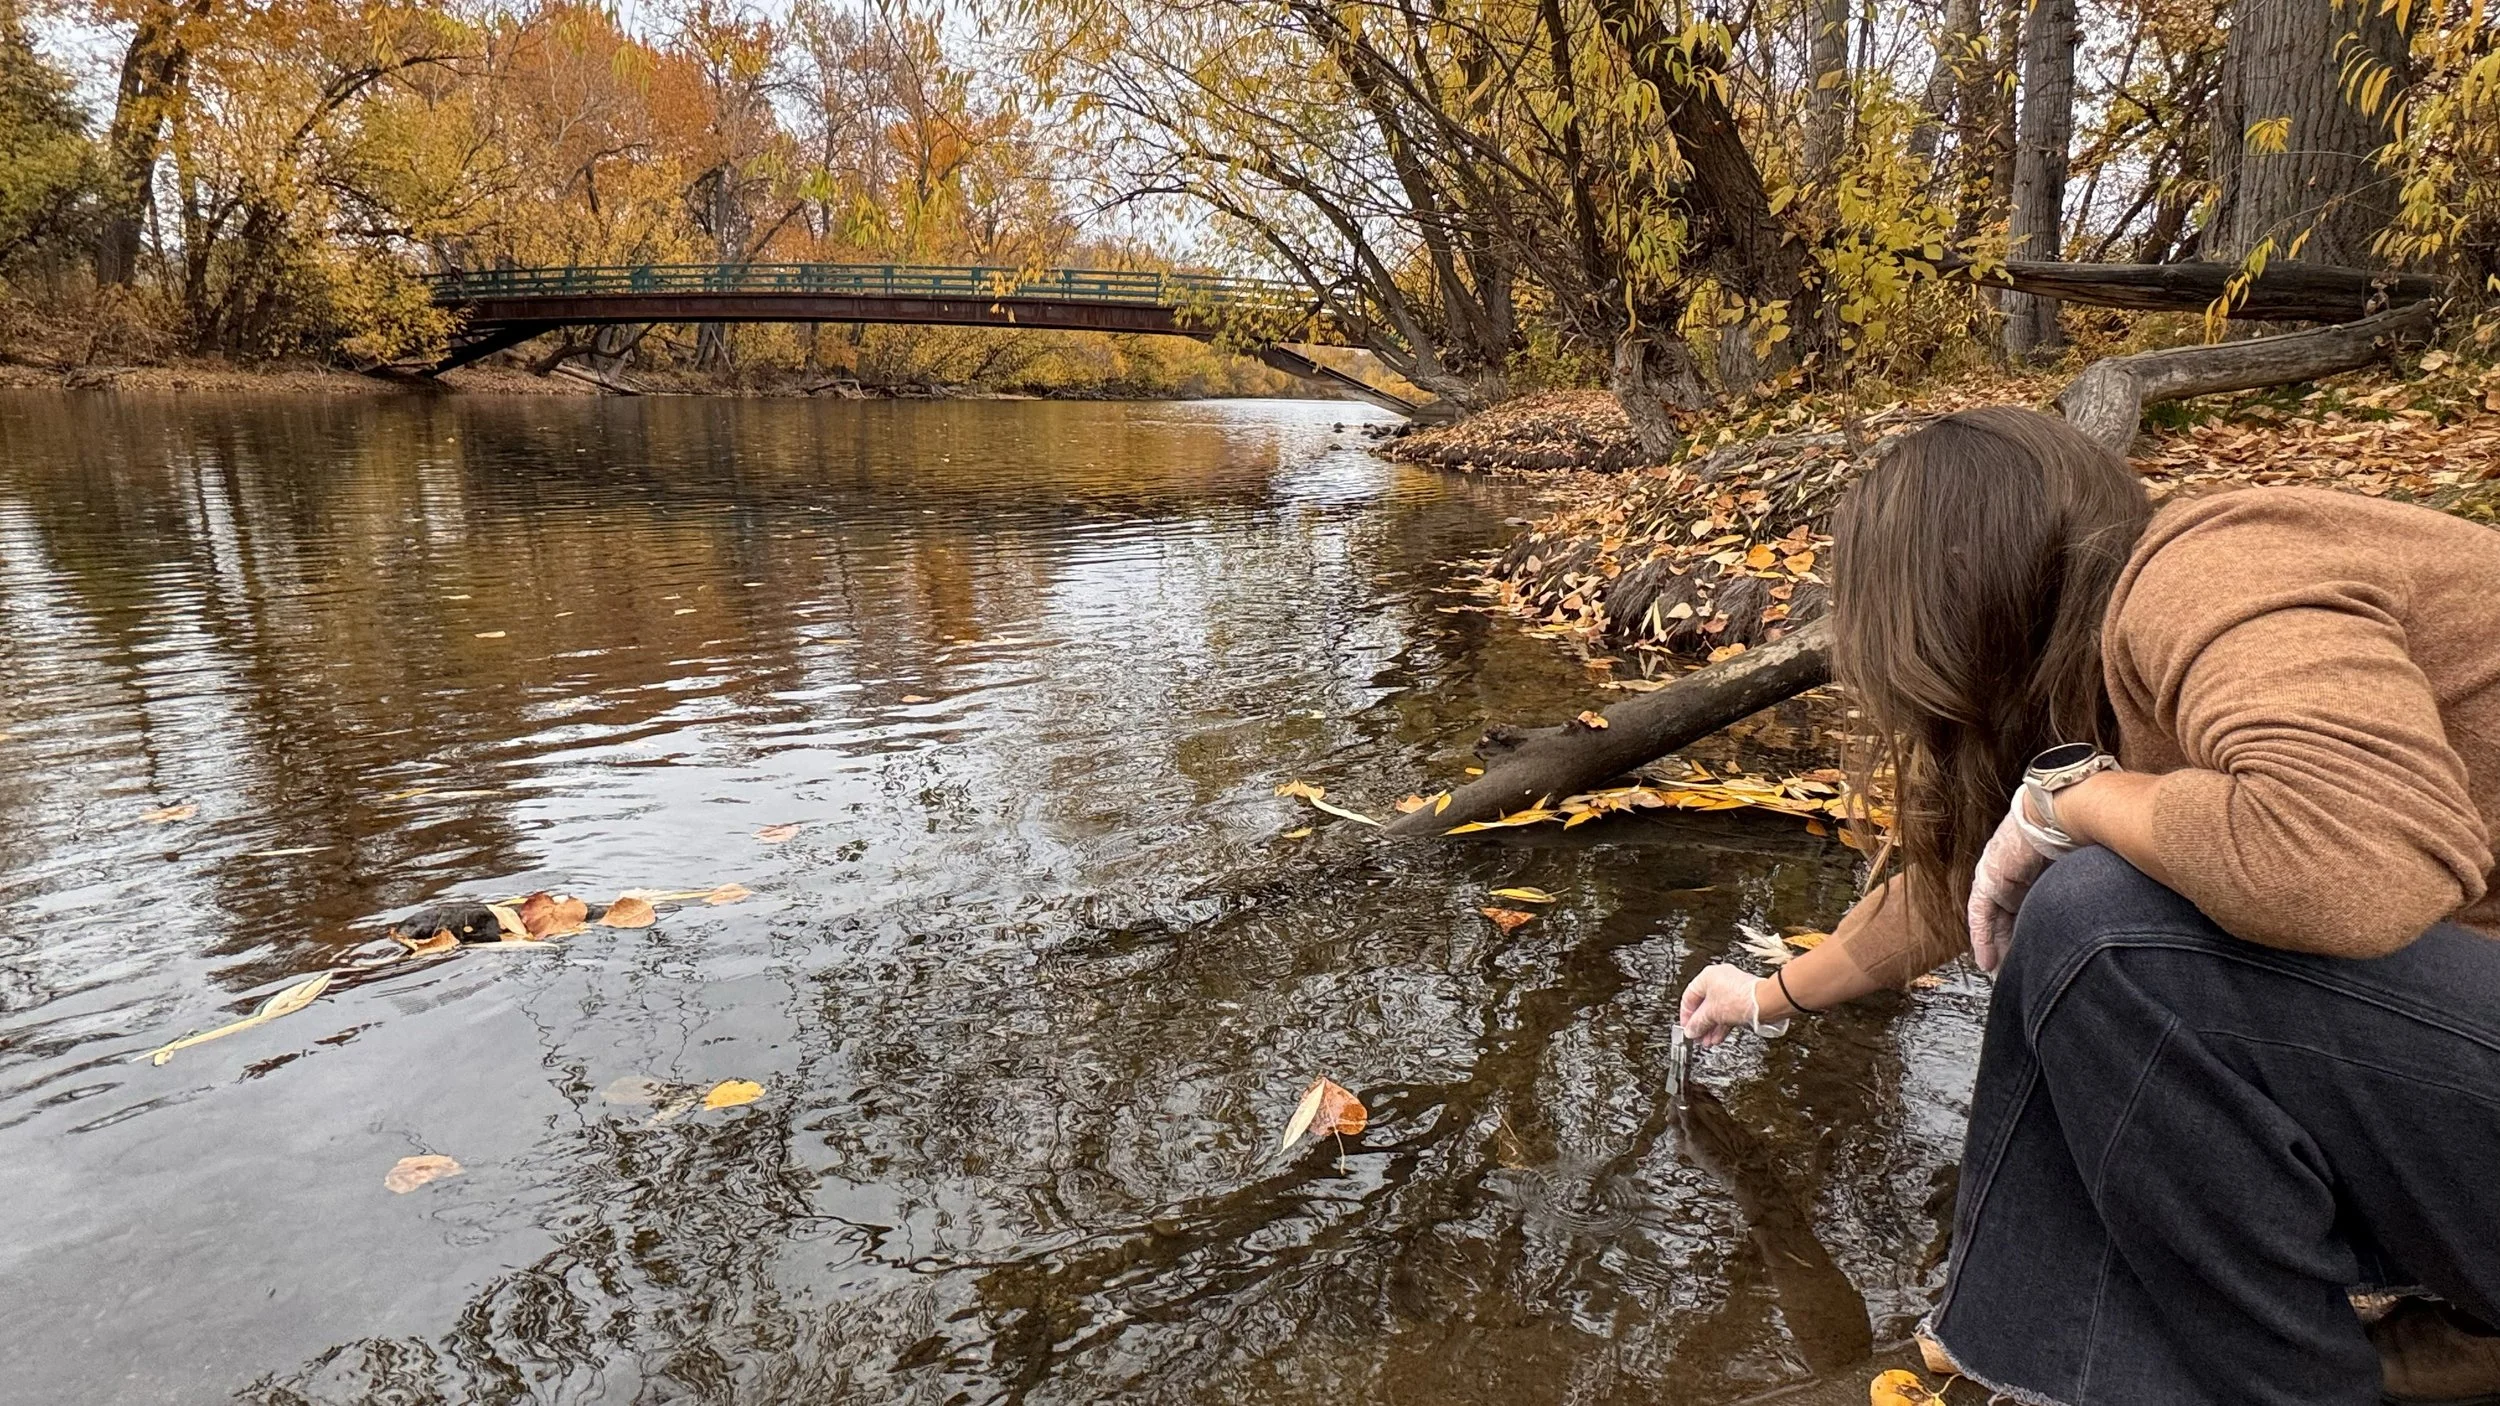
The BRS program is a self-guided volunteer opportunity designed to build stronger advocates for the Boise River through stewardship, education, community engagement, and citizen science. Stewards are required to complete three activities that benefit the Boise River, two water quality assessments, and attend an IRU training session that provides an overview of the history of the Boise River, factors that impact the river’s overall health, and the skills needed to successfully complete the program.
The initial River Stewardship program launched in 2023 with 11 stewards and tripled to 35 in 2025. We continually update the program to add new opportunities and ensure it has the greatest impact on the health of the Boise River. For example, in 2024, we added an ambassador team to the program for returning stewards to help cultivate leaders in our community. Additionally, thanks to the generosity of our supporters and especially the Ford Dealers of Idaho, in 2025, we were able to purchase water quality testing kits and hanging scales to accurately measure the collective efforts of our stewards, leading to the creation of the Boise River Report Card.
During the 2025 season, our BRS team donated 486 hours – leading 15 cleanups for our local community, collecting 937 pounds of trash, and conducting 103 water quality samples on the Boise River. In addition to their hands-on efforts – stewards engaged with our community, leading discussions about IRU’s conservation efforts and ways our community can be involved in the stewardship of their urban river.
If you are interested in joining our 2026 BRS program, please visit our Volunteer page to learn more and apply.
Testing Locations
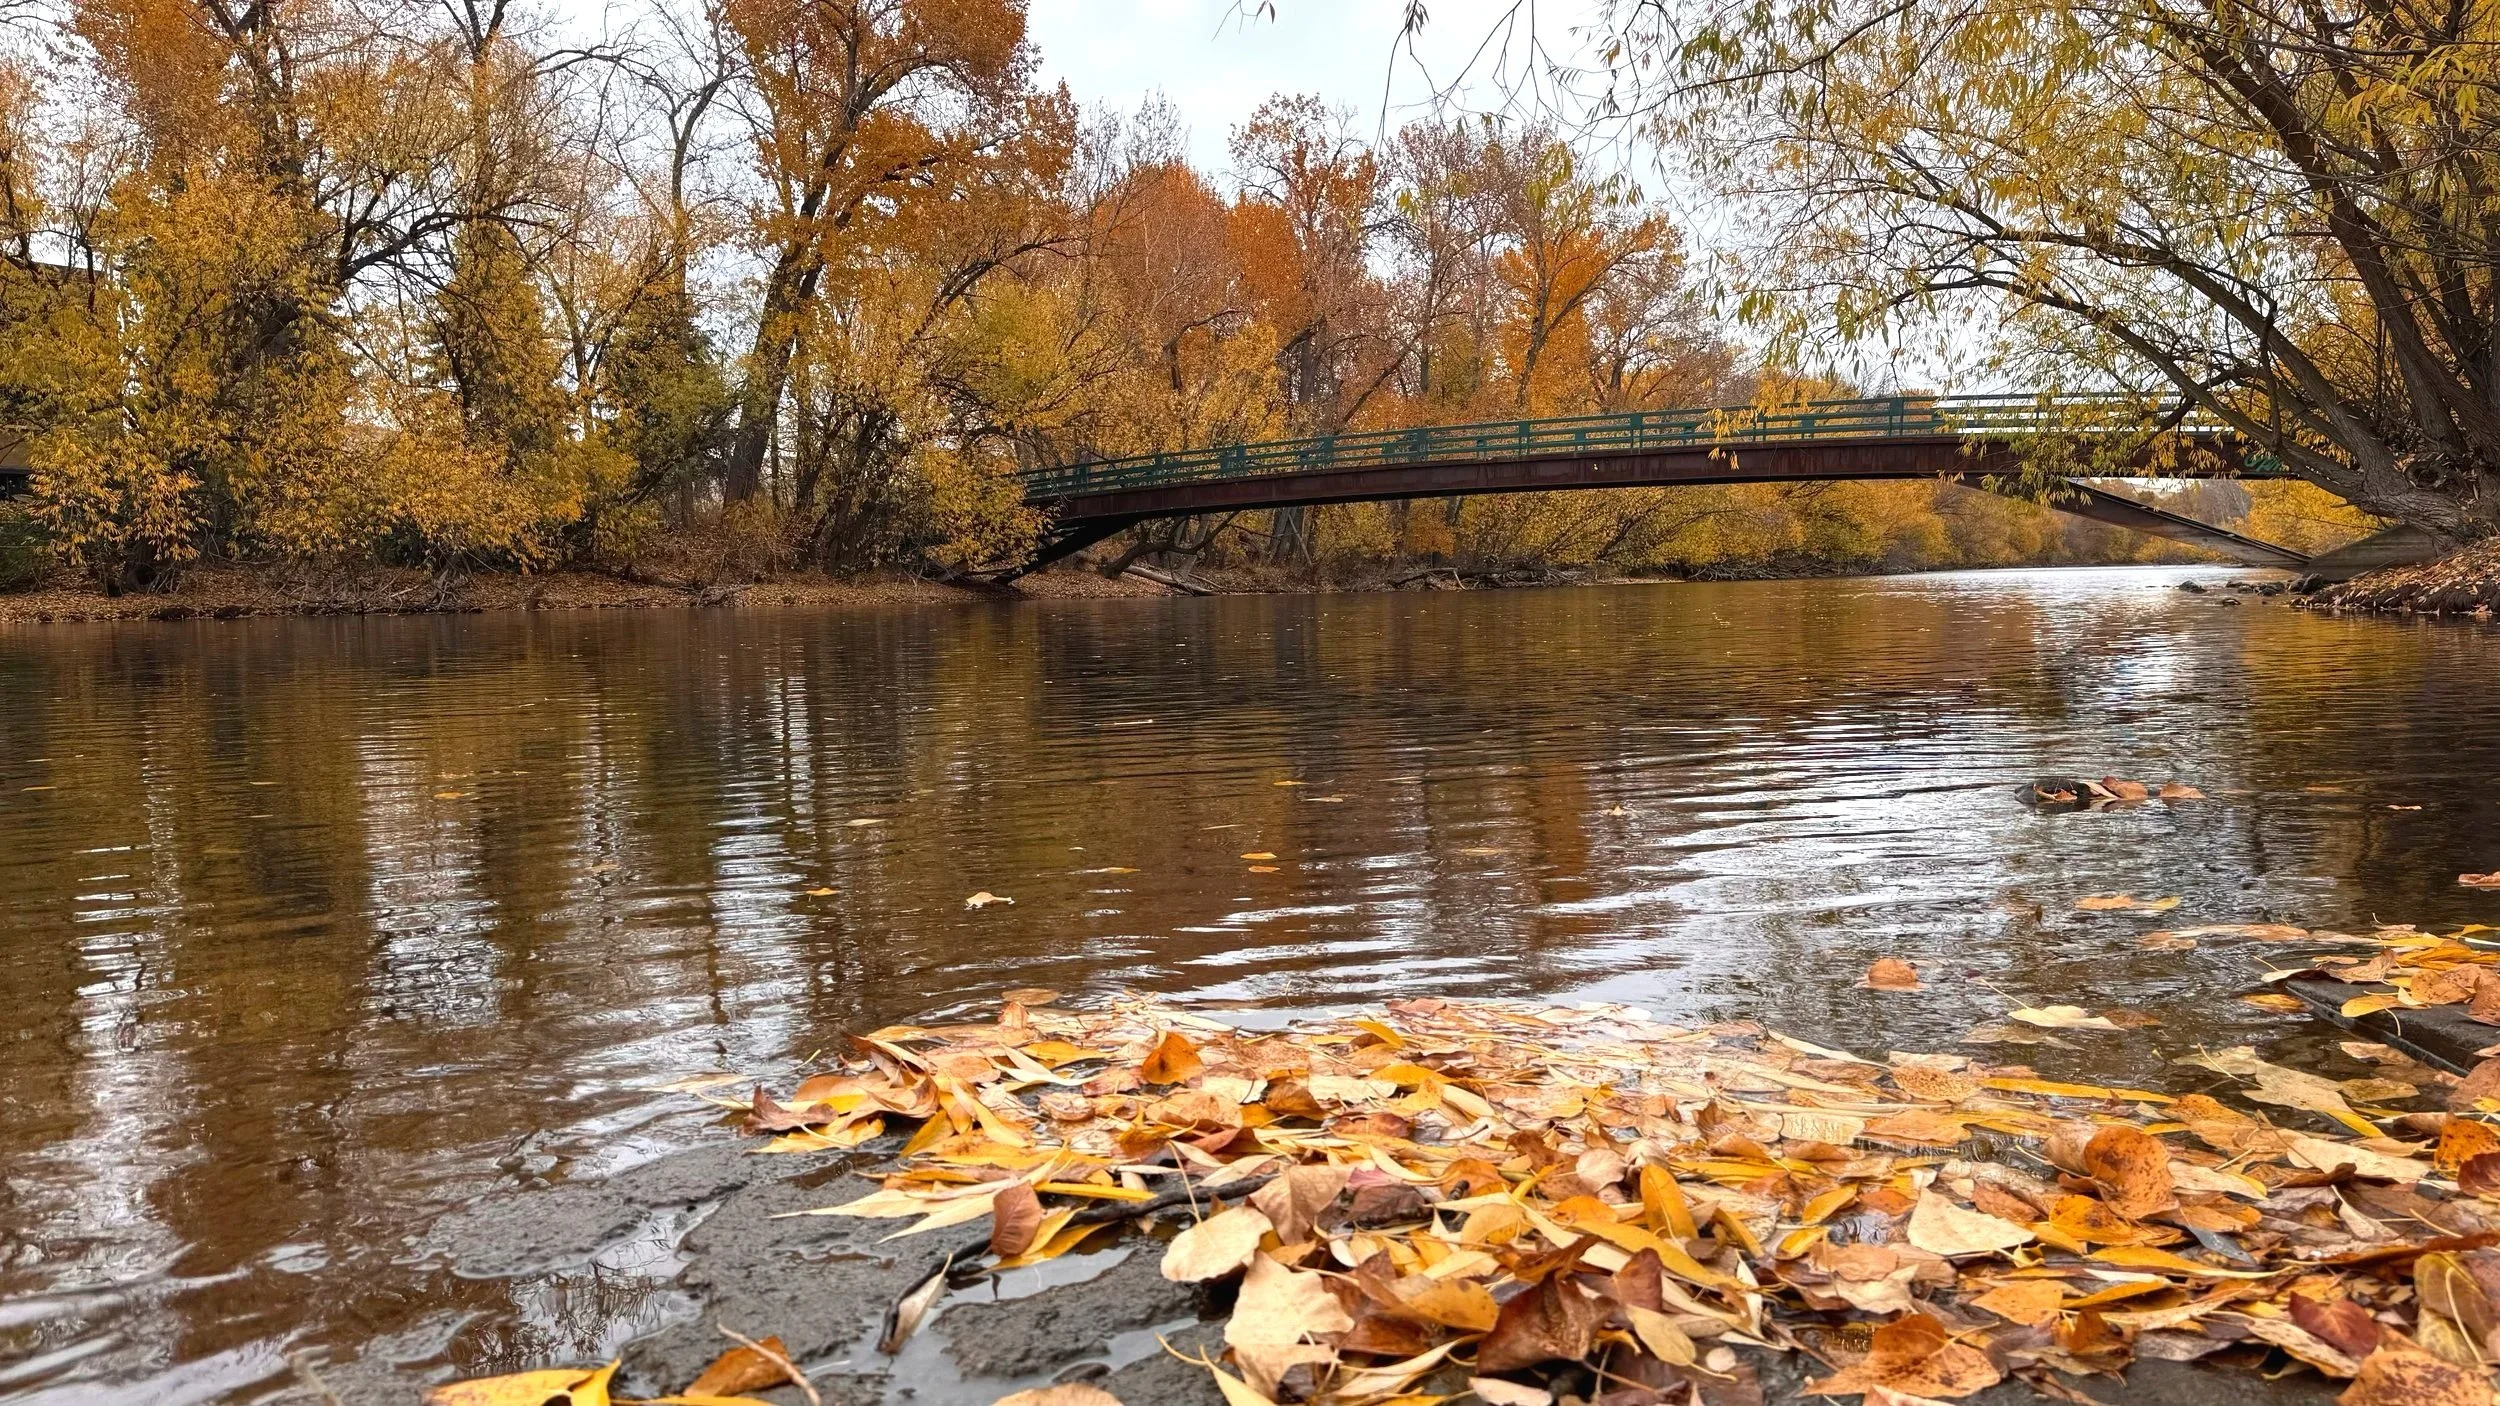
IRU’s Boise River Stewards collected water-quality samples from three predetermined locations along the river from June 2025 to November 2025:
• Site #1: Americana Bridge (43.6149, -116.22167)
• Site #2: Parkcenter Boat Ramp (43.59507, -116.17472)
• Site #3 Barber Park (above the float season put-in) (43.56621, -116.13346)
*Note that no water quality surveys were recorded in the month of August due to this program being self-led; stewards are able to conduct surveys when it best suits their schedule.
A total of 103 water quality surveys were conducted across the 3 locations. In each survey, Boise River Stewards collected data on the river’s temperature, dissolved oxygen levels, biochemical oxygen demand, pH, nitrate levels, phosphate levels, turbidity, and the presence of total coliform bacteria. This summary highlights how healthy the river is and what conditions looked like during the 2025 sampling season.
The Water Quality Tests
-
Temperature affects almost everything in a river. Each species—whether trout, mussels, or aquatic insects—has a temperature range it’s comfortable in. The section of the Boise river that runs through Boise supports cold water aquatic life and salmonid spawning, so it is imperative that river temperatures remain below 22 degrees Celsius.
If water is too warm, fish may become stressed, eat less, or fail to reproduce. Warm water also holds less oxygen, which can lead to low DO levels.
Warmer temperatures can increase the growth of bacteria and algae, sometimes triggering harmful algal blooms.
If water gets colder than normal, it can also shock species or slow their growth.
Temperature changes often come from loss of shade along riverbanks, stormwater runoff from hot pavement, or releases of warm water from industrial or water-treatment facilities.
-
pH measures the activity of hydrogen ions in a water sample, meaning it shows how acidic or alkaline the water is on a scale from 0 to 14:
7 = neutral
Below 7 = acidic
Above 7 = alkaline
Most aquatic life thrives when the pH is between 6.5 and 8. Water outside this range can cause stress or even be deadly.
Different pH levels change how nutrients and metals behave in the water. Low pH (more acidic) can dissolve harmful metals, making them more toxic to fish and people. High pH can damage fish gills, skin, and eyes, reduce reproduction, and lower overall species diversity.
Changes in pH can come from acid rain, industrial runoff, wastewater, or even natural geology and soils.
-
Just like people need oxygen to breathe, fish, insects, and other aquatic animals need oxygen dissolved in the water. Dissolved Oxygen (DO) mainly comes from two sources:
air mixing into the water, especially in fast-moving or turbulent areas (one of the reasons IRU wants more free-flowing rivers: more whitewater = more oxygen)
aquatic plants releasing oxygen during the day
Healthy rivers will have DO levels between 5–6 milligrams per liter (mg/L) or higher. When DO levels drop too low, fish and other aquatic organisms can become stressed, struggle to feed, or even suffocate.
Things that can lower DO include:
warm water, which simply can’t hold as much oxygen as cold water
pollution, especially sewage or decaying leaves and algae
algal blooms, which use up oxygen when they die and decompose
-
Turbidity is a measure of how clear the water is. In short, the clearer the water, the better. Water that is cloudy or muddy water has high turbidity.
High turbidity can:
block sunlight, reducing plant growth and oxygen production
clog fish gills, making it harder for them to breathe
bury fish eggs or the habitat of insects that fish depend on
increase water temperature because muddy water absorbs more heat
often appear alongside other problems like low DO and higher pollution levels
Common causes of increased turbidity include soil erosion, stormwater runoff, construction, algae growth, and disturbances from boats or livestock.
-
Biochemical Oxygen Demand (BOD) measures how much oxygen is being used by bacteria as they break down organic material such as dead plants, sewage, or runoff from farms. Think of BOD as a “competition meter” between bacteria and aquatic animals:
High BOD means bacteria are using a lot of oxygen, leaving less for fish and insects.
Low BOD means the water is relatively clean and oxygen is more available for wildlife.
When BOD is high, DO levels often drop, which can suffocate oxygen-sensitive species. High BOD is usually a sign of organic pollution, such as untreated wastewater, livestock runoff, or large amounts of decaying vegetation. In slow-moving waters, dissolved oxygen is often consumed by bacteria rather, leaving little left for other aquatic organisms.
-
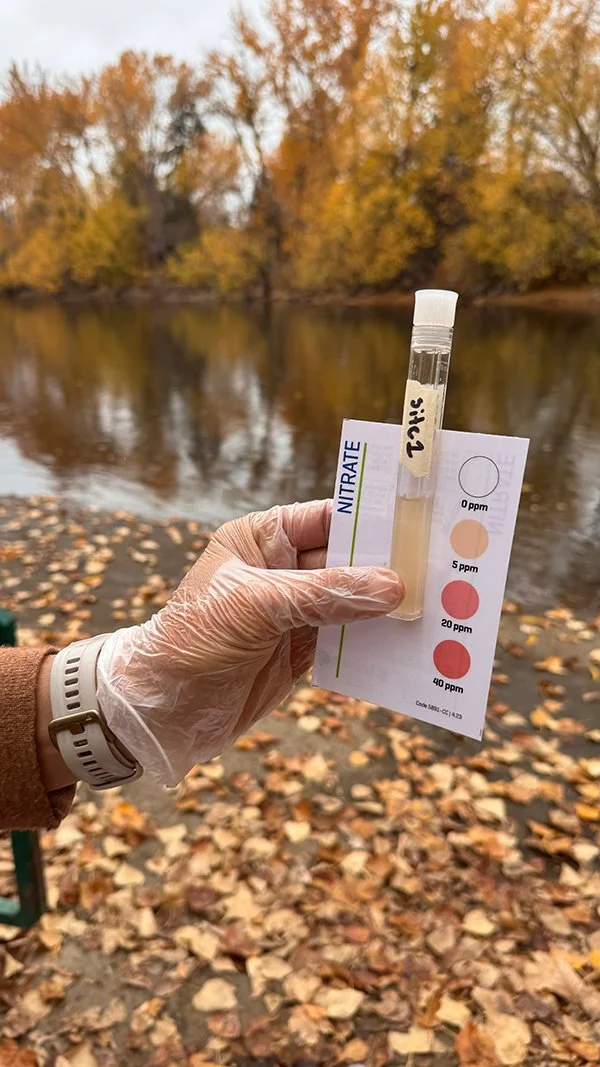
Nitrogen occurs naturally in our rivers and is a nutrient that fertilizes aquatic plants. However, if concentration levels are too high it can lead to excessive plant and algae growth, resulting in poor water quality conditions. Nitrogen can appear in several forms, including nitrate, nitrite, and ammonia. The tests the stewards conducted focused on the nitrate levels in the Boise River.
Waters with less than 4 mg/L of nitrate are generally considered unpolluted and helps support healthy plant communities. At high levels, it can:
fuel algal blooms that reduce oxygen
be toxic to fish, especially ammonia
make drinking water unsafe
Nitrogen can enter our waterways from sources such as fertilizers, sewage, manure, stormwater runoff, and decomposition of organic matter (for example: fallen leaves that decompose in the river).
-
Like nitrogen, phosphorus occurs naturally in our rivers and is a nutrient that fertilizes aquatic plants in small concentrations. The tests the stewards conducted measured the phosphate levels in the Boise River. Phosphate is the most commonly used form of phosphorus by biological organisms, as it is utilized to help form DNA, cellular energy, and cell walls. However, phosphate levels that are higher than 0.03 mg/L can result in poor water quality conditions.
High levels of phosphorus can lead to:
Excess phosphorus can cause algae to grow rapidly, leading to algal blooms.
When these blooms die, they use up dissolved oxygen, which can suffocate fish and other organisms.
Some algae can produce toxins harmful to wildlife, pets, and people.
Phosphate can enter the water through runoff of fertilizers, wastewater, detergents, soil erosion, and decaying organic matter.
-
Total coliforms are a large group of bacteria commonly found in soil, plants, and surface water, as well as in the digestive systems of people and animals. While most of these bacteria are harmless, there are fecal coliforms, such as E.Coli, that can be harmful to humans and animals if they contaminate our waterways. We test for them because they act like warning lights: their presence can suggest that conditions exist that might also allow harmful germs to survive in the water.
The tests our stewards used simply show whether total coliform bacteria are present or not. Tests will show a positive result if there are more than 20 total coliform colonies per 100 mL of water. However, positive tests do not show the exact concentration level of total coliform, nor do they specify what kind of coliform bacteria is present. Still, if total coliforms show up often or at high levels, it may indicate that the water has been exposed to runoff, waste, or decaying material. This could mean the water is less safe for activities like swimming, and it may stress aquatic species that rely on clean, oxygen-rich water.
Temperature measured in degrees Celsius
Average 12.7°C
Ideal Temperature: <22°C for cold water aquatic organisms and <13°C for salmonid spawning
The results ranged from 6°C to 20°C; these temperatures are typical for the Boise River and support most cold-water species. Warmer days later in the season pushed temperatures toward 20°C, which is not uncommon for shallow, sunlit rivers.
Results
Turbidity measured in Jackson Turbidity Units (JTU)
Average turbidity: 15 JTU
Range: 0–100 JTU (0=excellent, >0-40 is good; >40-100 is fair; >100 is poor
The river stayed consistently clear, with most readings well within the healthy range for recreation and wildlife.
pH Level
Average 7.32
Ideal range: 6.0-8.0
The ideal range for healthy freshwater streams is between 6.0 and 8.0. A pH near neutral supports a wide variety of fish and other aquatic organisms, meaning the Boise River is nearly perfect in this regard.
Dissolved Oxygen (DO) measured in milligrams per liter (mg/L)
Average DO 4.27 mg/L
Omitting test results with 0s, average is 4.5 mg/L
Range: 8+ mg/L is excellent; 5-6 mg/L supports aquatic growth and activity; <5–3 mg/L starts stressing aquatic organisms and is not sustainable long term; <3 mg/L is extremely stressful to aquatic life.
Due to limitations of the testing kits, not enough precision was possible to provide an accurate representation of DO levels. We believe the 4.27 mg/L result may be inaccurate, as it would result in lower aquatic life populations than what we can observe in the river. Some results came back as 0 mg/L, which is nearly impossible for rivers; they would have to be slow-moving and heavily polluted. Because it is highly unlikely that the Boise River contains no dissolved oxygen, recordings of 0 mg/L were excluded, resulting in a revised average DO concentration of 4.5 mg/l. However, this average DO level still falls near the lower limit of fish tolerance and is unsuitable for prolonged exposure.
Many readings fell in the “fair” category, with some excellent values and some low readings. This indicates the river generally supports aquatic life, though oxygen can dip during warmer or slower-flow periods.
Biochemical Dissolved Oxygen measured in milligrams per liter (mg/L)
Average BOD: 3.28 mg/L
Ideal level: <2 mg/L
>8 mg/L would indicate poor water quality
Lower BOD values mean the river isn’t overloaded with organic pollution. Boise River values suggest fair water quality, with some oxygen depletion from decaying materials.
Nitrates measured in milligrams per liter (mg/L)
Average: 4.24 mg/L (Fair)
Range: 0.1 - 10 mg/L
0.1-1 mg/L is excellent; 1-3 mg/L is good; 3-5 mg/L is fair; >5 mg/L is poor; 10 mg/L is EPA’s max contamination level drinking water standard
Nitrate levels hover near the threshold of natural background levels, but well below drinking water limits. These concentrations are typical for an urban river and not high enough to cause algae problems.
Phosphates measured in milligrams per liter (mg/L)
Average: 2.48 mg/L
Ideal range: <0.03 mg/L; >0.1 mg/L indicates poor water quality.
*0.07 mg/L is the TMDL for the Boise river past Parma
Phosphate levels tested high, however the test kits used did not have the ability to read small concentrations or provide precise measurements. The reported results were too sporadic to find a pattern or fit a trendline. The results have been deemed inconclusive due to the testing equipment not producing reliable results.
Total Coliform Bacteria
The tests employed simply return a result of positive or negative, but no indication of concentration level; around 75% of our results were positive. To get a true sense of whether the river is host to a worrisome level harmful coliform bacteria, further testing is necessary to identify the kind of bacteria and that quantifies the number of colonies found. Given the limitations of the equipment used, these results indicate the presence of coliform bacteria but do not assess whether they pose a health concern.
Trash Removal
Another aim of the Report Card is to identify and highlight trash removal from in and around the Boise River. As previously mentioned, efforts led by the Boise River Stewards resulted in 937 pounds of trash being picked up during 15 cleanups. Overall, IRU organized 23 cleanups in 2025 that removed 3,850 pounds of trash! Our aim for future iterations of the Boise River Report Card is to include numbers from other organizations hosting cleanups.
Testing Limitations
Testing methods for some of the parameters did not have the ability to read low enough concentrations to provide precise measurements, leading to some of the results not accurately reflecting the river conditions. Specifically, we noticed discrepancies for the phosphorus readings, as well as some of the dissolved oxygen and nitrogen results. As this program continues, we are working to find water quality tests that provide more accurate and precise results for our citizen scientists to utilize.
After studying the results of 103 water quality tests, we have drawn several conclusions about the State of the Boise River. On the surface, it is doing very well in several qualities apparent to the citizens of the Treasure Valley. It is continually manicured by cleanup groups such as the Boise River Stewards and groups apart from IRU’s volunteer army. The water is clear and the pH is spot on, enhancing the quality of aquatic life. On average, the temperature is great for most coldwater species to thrive. Because of these conditions, the river corridor through Boise is thriving in terms of recreational value and supporting many aquatic species.
On the other hand, some signs point toward areas of concern and opportunities to gather better data. The amount of oxygen in the water available for aquatic species may be less than ideal, but there are caveats. Our testing kits proved to be inadequate to determine with fine precision levels of dissolved oxygen, and the test results don’t seem to reflect observable levels of aquatic life. Coliform is present, but given the testing kits used, we could not identify concentrations or types of the bacteria present. Nitrate and Phosphate tests did not have the ability to detect small concentrations and returned results too broad to accurately depict current levels in the Boise River through this stretch.
Reflecting on the body of results, we believe the Boise River to be reasonably healthy. Some factors keep it from fully supporting all of its beneficial uses; conditions for salmonid spawning and coldwater aquatic life are suboptimal due to temperature, low flows, and habitat alteration. Despite these shortcomings, it is certainly better in all respects compared to past decades. Government policies and citizen efforts have enhanced the quality of life for both aquatic species and the people who depend on it. We hope these efforts continue and that this jewel of the Treasure Valley becomes a model for urban river conditions in the future.
State of the River 2025
Additional Resources
Made possible by the Riverside Hotel, Ling & Louie’s, and Ford Dealers of Idaho
